
tennis
How Often Do Tennis Matches End in Straight Sets?
A model that gets win probability right can still be wrong about how a match gets there. We checked whether ours was.
The question
Given a player’s win probability for a match, what is the chance the match ends in straight sets (2-0 in best-of-three, 3-0 in best-of-five)? A simple approach treats the sets of a match as independent events. That approach is measurably wrong, and the gap is large enough to matter for anyone pricing set-based markets.
What we measured
We took 23,898 best-of-three matches with real closing odds, played between 2020 and 2025, and grouped them by the favorite’s win probability. Only matches that were played to a finish are included. For each band we compared what the raw independent-sets model predicted against what actually happened. The table covers best-of-three only; best-of-five was measured separately and is described below.
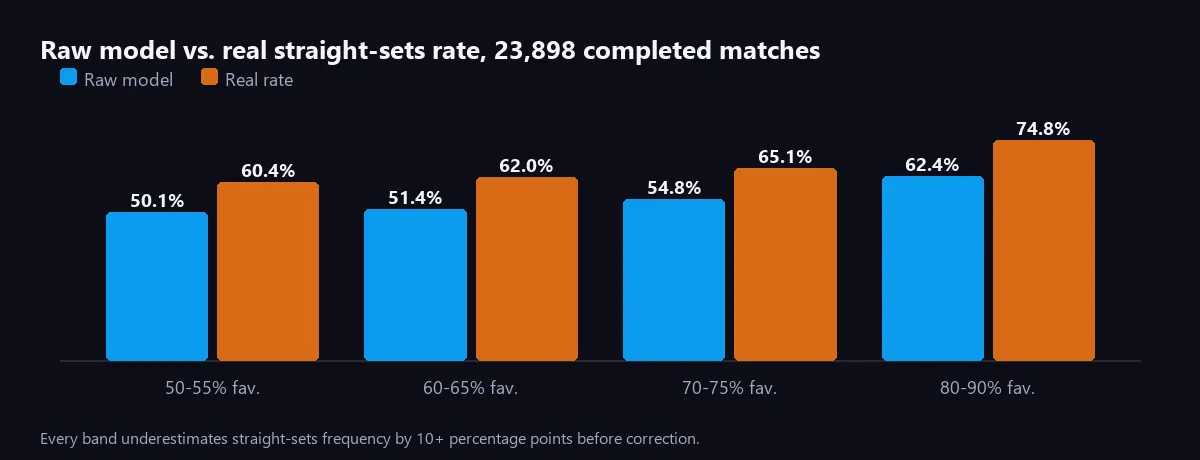
| Favorite’s win probability | Raw model | Real rate | Gap |
|---|---|---|---|
| 50-55% | 50.1% | 60.4% | +10.3pp |
| 60-65% | 51.4% | 62.0% | +10.6pp |
| 70-75% | 54.8% | 65.1% | +10.3pp |
| 80-90% | 62.4% | 74.8% | +12.4pp |
A fifth band, favorites above 90%, shows the same direction with a larger gap: the raw model gives 71.8%, the real rate is 86.6%, a difference of 14.8 points. For everyone between 50% and 90% the gap stays between 10.3 and 12.4 points, not just at the extremes. That steadiness is the useful part: it means the fix does not need a complicated, band-specific curve.
Why sets are not independent
Real matches do not behave like a series of separate coin flips. The pattern in our data is simple: a player who loses the first set wins the second less often than an independent model assumes. Form on the day, mindset, and underdogs who give up the match all point in that direction. We cannot separate these causes with the data we have, and we do not need to for the correction to work: it falls out of treating a match as a sequence of correlated events instead of independent ones.
The fix
Rather than build a per-band curve, which would risk fitting noise, we apply a flat additive correction: +10.7 percentage points to the raw straight-sets probability for best-of-three matches. Best-of-five matches were measured separately, on 2,810 matches, and get +12.7 points.
The correction is close in the middle of the range and weaker at the top. Applied to the table above, the predicted rate ends up within half a point of the real rate for favorites between 50% and 75%. Heavy favorites are still under-predicted, by about 2 points at 80 to 90% and by about 4 points above 90%. We accept that: a bandwise curve would fix the top end, but it would also add complexity to a correction that is already accurate where most matches sit.
Where this matters in practice
This is not a moneyline correction, so it does not change who the model favors to win the match. It matters for anything that prices the path to that result: set betting, straight-sets markets, and any total-games estimate built by simulating sets. A totals model that assumes independent sets inherits the same bias and underestimates how long matches run.
The limits
23,898 matches is a large sample, but it only covers matches with available closing odds, and those exist mostly for bigger tournaments. The correction is also population-level, not player-specific: a player whose game does not follow the average pattern would still be slightly mispriced by a single global factor. We use a flat correction because it was measured on a large sample and does not overfit, not because every player follows it identically.
Related: why tennis ratings need to be surface-specific covers a different kind of correction to the same underlying win-probability estimate this analysis builds on.
Frequently asked questions
- Why isn't a match's win probability enough to estimate straight-sets probability?
- Because sets in a match are not independent of each other. A raw model that treats each set as an independent event, with a per-set probability derived from the match model, underestimates the straight-sets rate by about 10 to 12 percentage points for favorites from 50% to 90%, and by about 15 points for favorites above 90%.
- How much does a raw model underestimate the straight-sets rate?
- In best-of-three matches, by 10.3 to 12.4 percentage points for favorites between 50% and 90% win probability, and by 14.8 points above 90%. We measured this against 23,898 best-of-three matches with real closing odds, 2020 to 2025.
- How does ServedBets correct for this?
- With a flat additive correction on top of the raw model: +10.7 percentage points for best-of-three matches, measured on 23,898 matches, and +12.7 points for best-of-five, measured separately on 2,810 matches. Heavy favorites above 90% are still slightly under-predicted after the correction.
- Does this affect moneyline picks or just set-betting markets?
- It matters most for set betting and straight-sets markets, which price exactly this outcome. It does not change who the model favors to win the match, so moneyline probabilities are not touched by it.